
#26: Using Claude Code to build a Professional College Statistics Website
Using Claude Code to build a Professional College Statistics Website

As a high school sophomore, I find myself constantly doing Google searches for college statistics like acceptance rates, yield, test scores, or class size. However, I recently found out that every college has a somewhat standardized set of reports known as Common Data Set (CDS) reports. These reports are a goldmine for prospective students as we can go deep into the data slices (admission rates or yield by gender, in-state vs. out-of-state, and more).
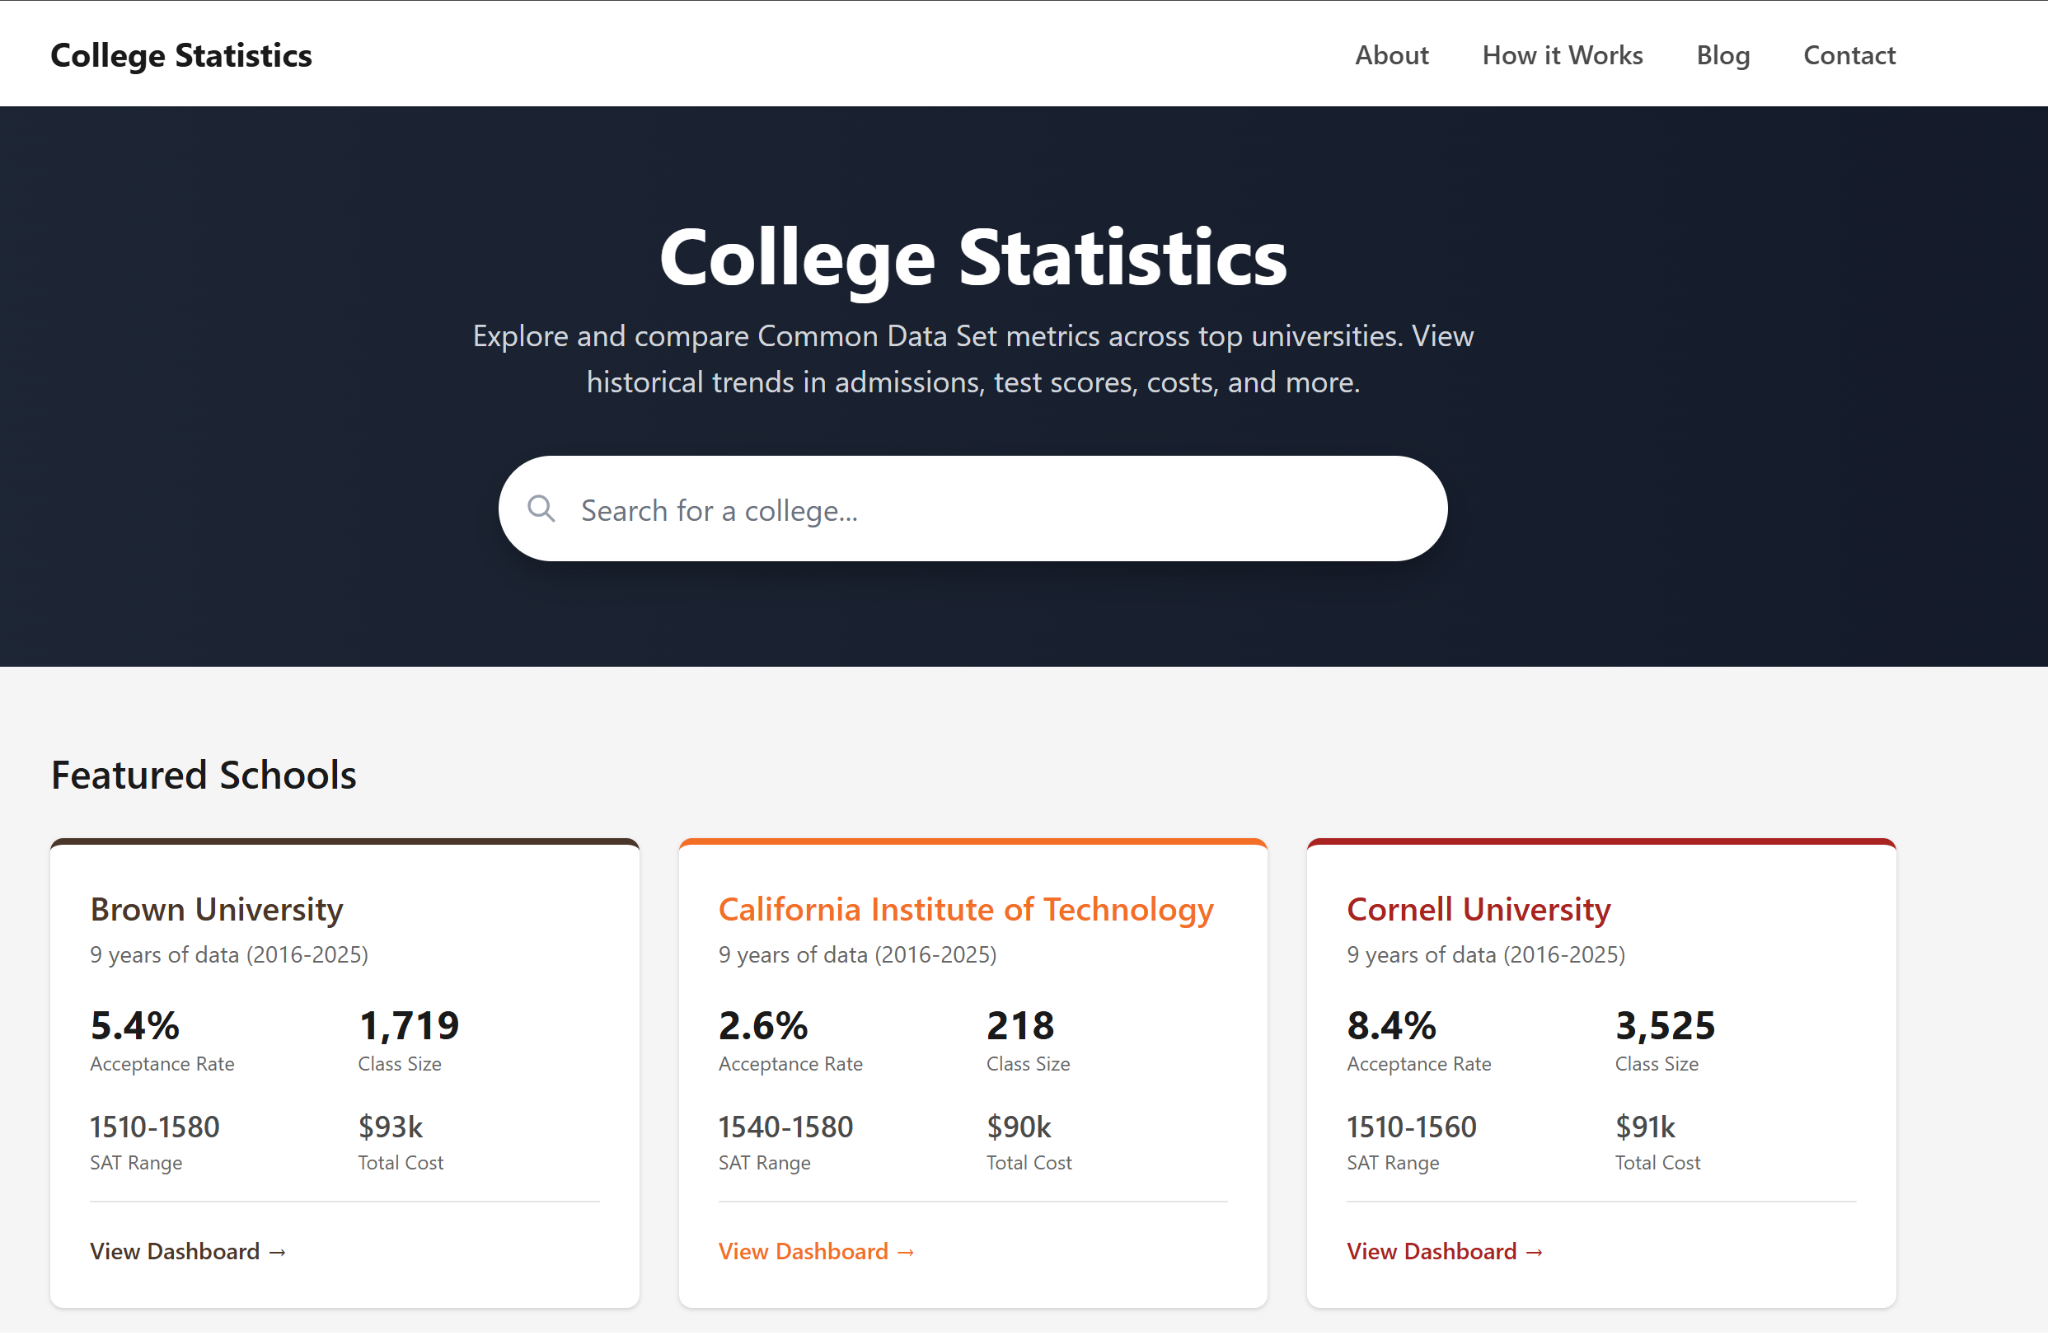
To make this data easy to consume, I decided to build collegestatistics.org, a website that combines and visualizes CDS data across top universities. Given all the hype around Claude Code and other GenAI tools, I also wanted to see if I could build this site using one of these tools in one night. My experience building this shocked me.
The Challenge
CDS reports are PDFs. Dozens of them, one per school per year. To begin, I downloaded data spanning 9 years across 10 universities, which meant close to 90 PDF files to process. Manually copying numbers into a spreadsheet would take forever, and building a parser from scratch would take even longer.
My goal: go from a folder of PDFs to a live website in a single evening.
How I Built It
I used Claude Code, Anthropic’s command-line tool that lets you describe what you want and have Claude write the code for you. Here’s how the night went:
PDF Parsing
I started by asking Claude to extract data from the CDS PDFs. It used a Python library called pdfplumber to read the files and pull out key metrics: acceptance rates, class sizes, SAT ranges, and costs. The output went into JSON files, one per school with all their historical data.
Fixing the Bugs
The initial extraction wasn’t perfect. Some numbers came out wrong, a 9.4% acceptance rate showing as 94%, a missing year here and there with some fields coming out as blank. But instead of debugging code myself, I just told Claude what was wrong: “Brown’s 2019 acceptance rate looks off, should be around 6-7%.” Claude figured out the issue and fixed it.
Building the Website
With clean data ready, I asked Claude to build a clean looking website made with React and Next.js. I described the layout I wanted: a homepage with cards showing each school’s key stats, and individual pages with historical trends. A few prompts later, adjusting colors, adding the “years of data” badges, tweaking spacing, the site was done. I then quickly bought a domain using Cloudflare, deployed my project with Vercel, and boom - the site was live in no time.
What Surprised Me
The whole process took about 2-3 hours. What would have been a multi-week project turned into a single evening. A few things stood out:
Describing beats coding. I spent zero time looking up documentation or debugging syntax errors. All my energy went into deciding what the product should do.
AI is great at tedious stuff. PDF parsing, data cleaning, bash commands - exactly the work I would have dreaded doing manually.
You still need to know your data. I caught errors because I had a sense of what the numbers should look like. If I’d blindly trusted the output, the site would have wrong data. Domain knowledge still matters. There’s still a high chance that some numbers could be wrong. If you see mistakes, please let me know.
Next Steps
Check out collegestatistics.org and let me know what you think. In terms of next steps, I’m planning to add more schools and additional data metrics like financial aid breakdowns. Once I have more schools added, I will also add the ability to compare schools, similar to how you could compare two stocks in Google Finance. If you want to contribute to the project, please submit issues or PRs at this project’s github page.
Love the dashboard! Amazing turnaround time on the build. Quick question: downloading 90 PDFs from individual sites sounds tedious. Is there a way for you to prompt Claude to access those data sources and handle the downloads automatically?